Statistics – SPIs
284
Revenue net
876
Departures
Condor, NJE, Marabu, Vista, LOT
TOP5
49%
Market share
Statistics at groundcomply.aero.
Automated statistics ready for you to use, track the most important handling risks.
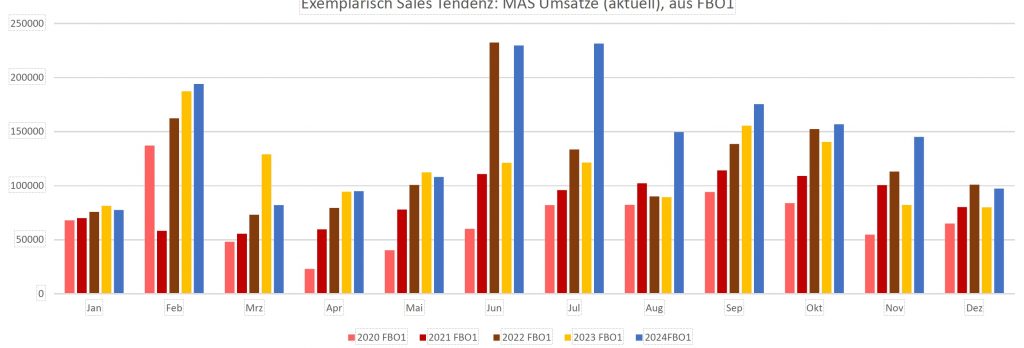
Revenue and Departures statistics
Top 5 customers and station revenues, providing a quick overview and enabling the tracking of potential risks from customer departures or sales fluctuations. Data is automatically imported via interface solutions.
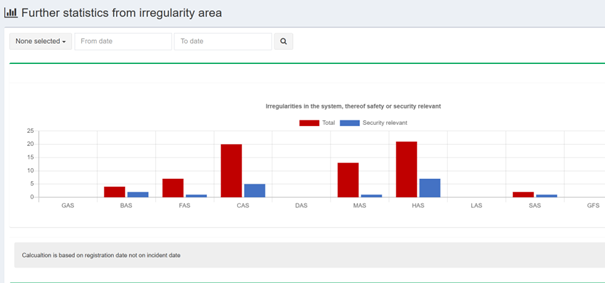
SPIs
Safety Performance Indicators are automatically generated from the risk reporting and light task systems and are available 24/7. They ensure compliance with the latest IS-BAH standards, EU regulations (EU 2025/20, EU 2018/1139), and the corresponding EASA GM/AMC requirements.
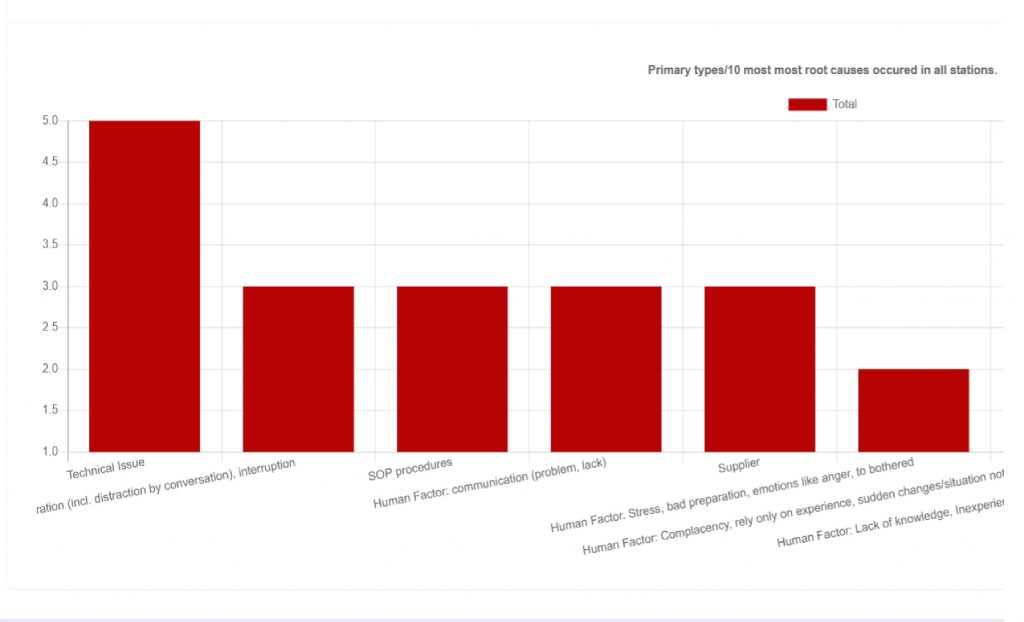
Root causes/ Mitigations graphics
The ten most frequent root causes and mitigations from the past four months are presented here for a quick overview about risks and measures.
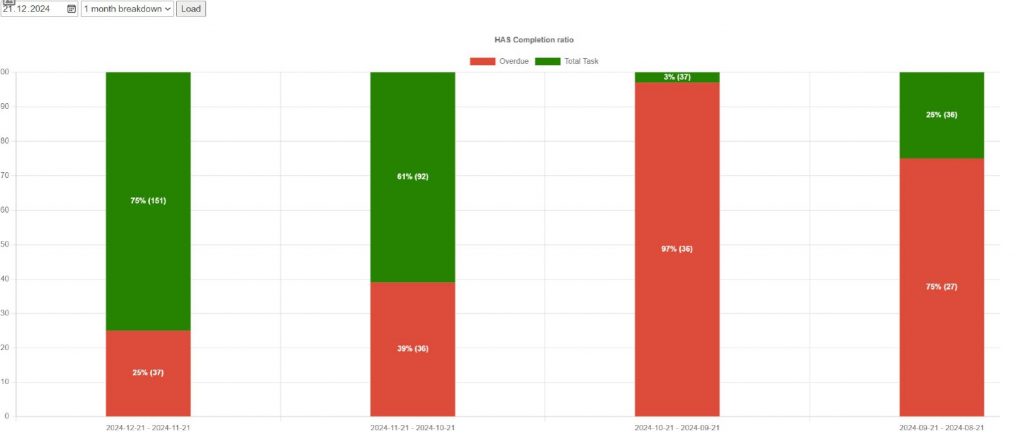
Compliance Ratios
The Task Compliance ratios are automatically generated and displayed in each employee’s “Timeline.” They are available either as a point-in-time analysis of the current total and overdue tasks or as a time-frame analysis of overdue and total tasks within a specific review period. Compliance ratios can also be filtered by station and user. Detailed ratios are provided separately for trainings, announcements, documents, vehicles, irregularities, and light tasks.
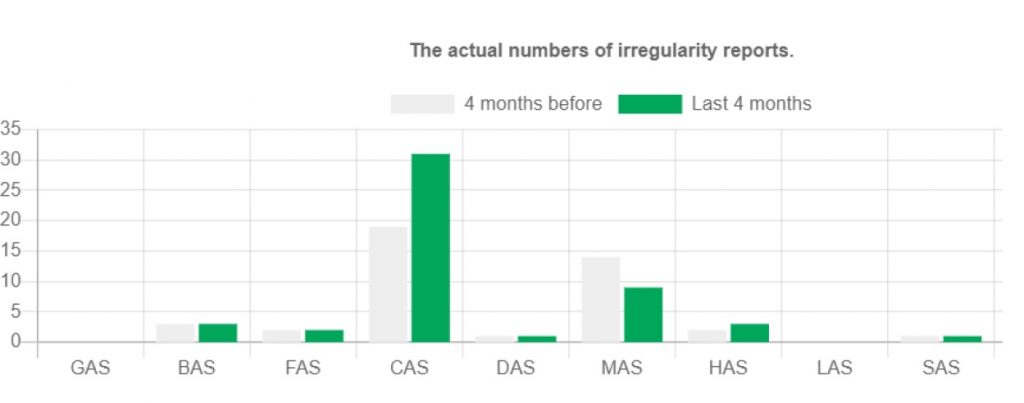
Additional statistics: Irregularity data to support sustainable mitigation
Track safety and security trends to enable rapid response if required.